Heles - Jan 2019 Updates
In the beginning of 2019 we've added many new features to the Heles.
- Calendar Heatmap
- Expenses Module
- New Dashboard
Calendar Heatmap
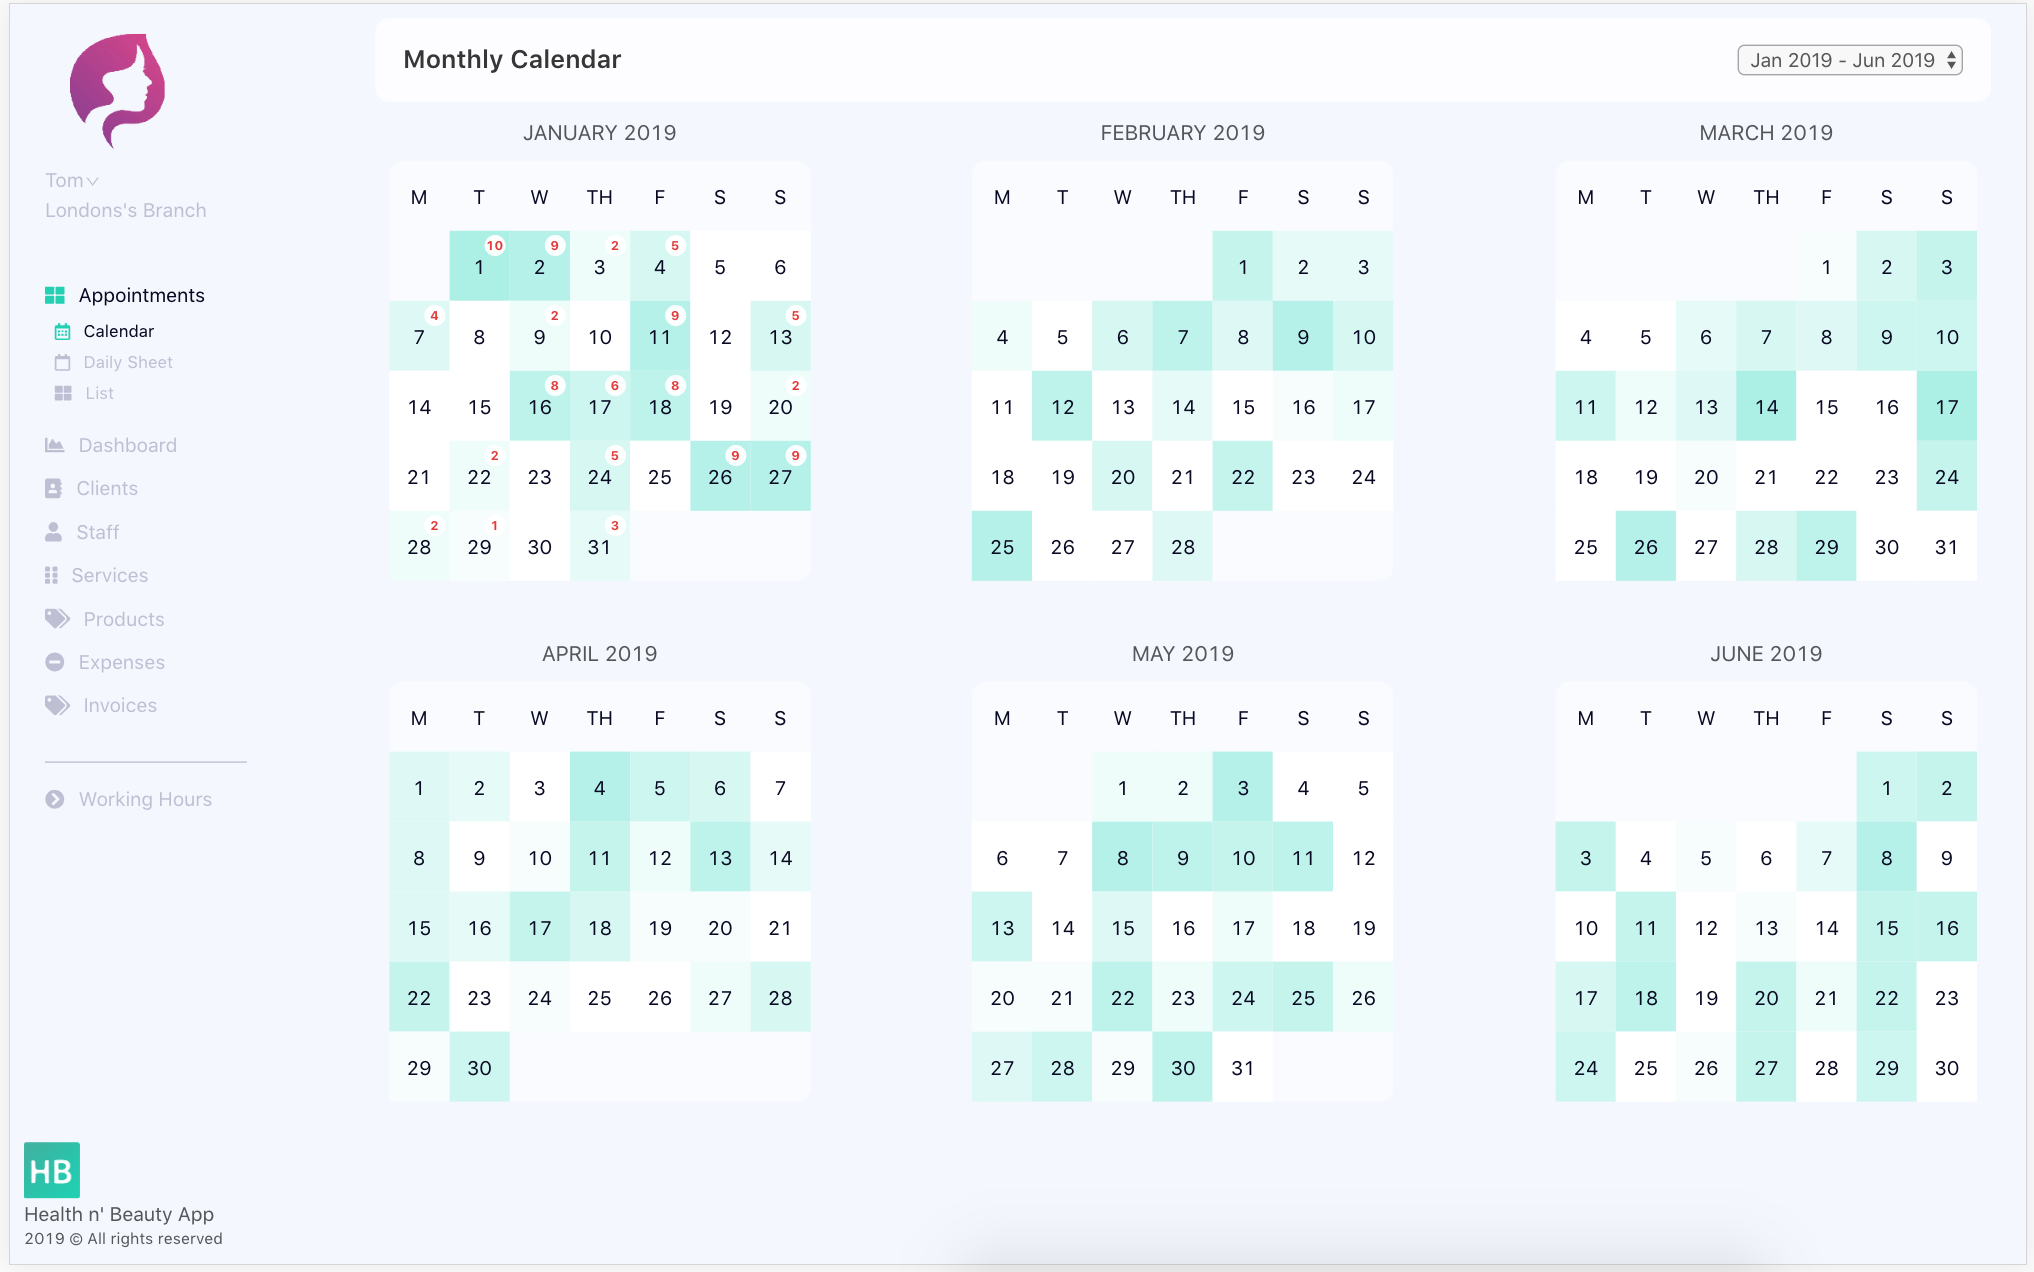
The calendar heatmap provides a global overview about the appointments' frequency, so you can easily recognize the peek days and plan accordingly.
Also it allows you to navigate easily between dates.
Note: Hover over a month to show the number of appointments on each day.
Expenses Module
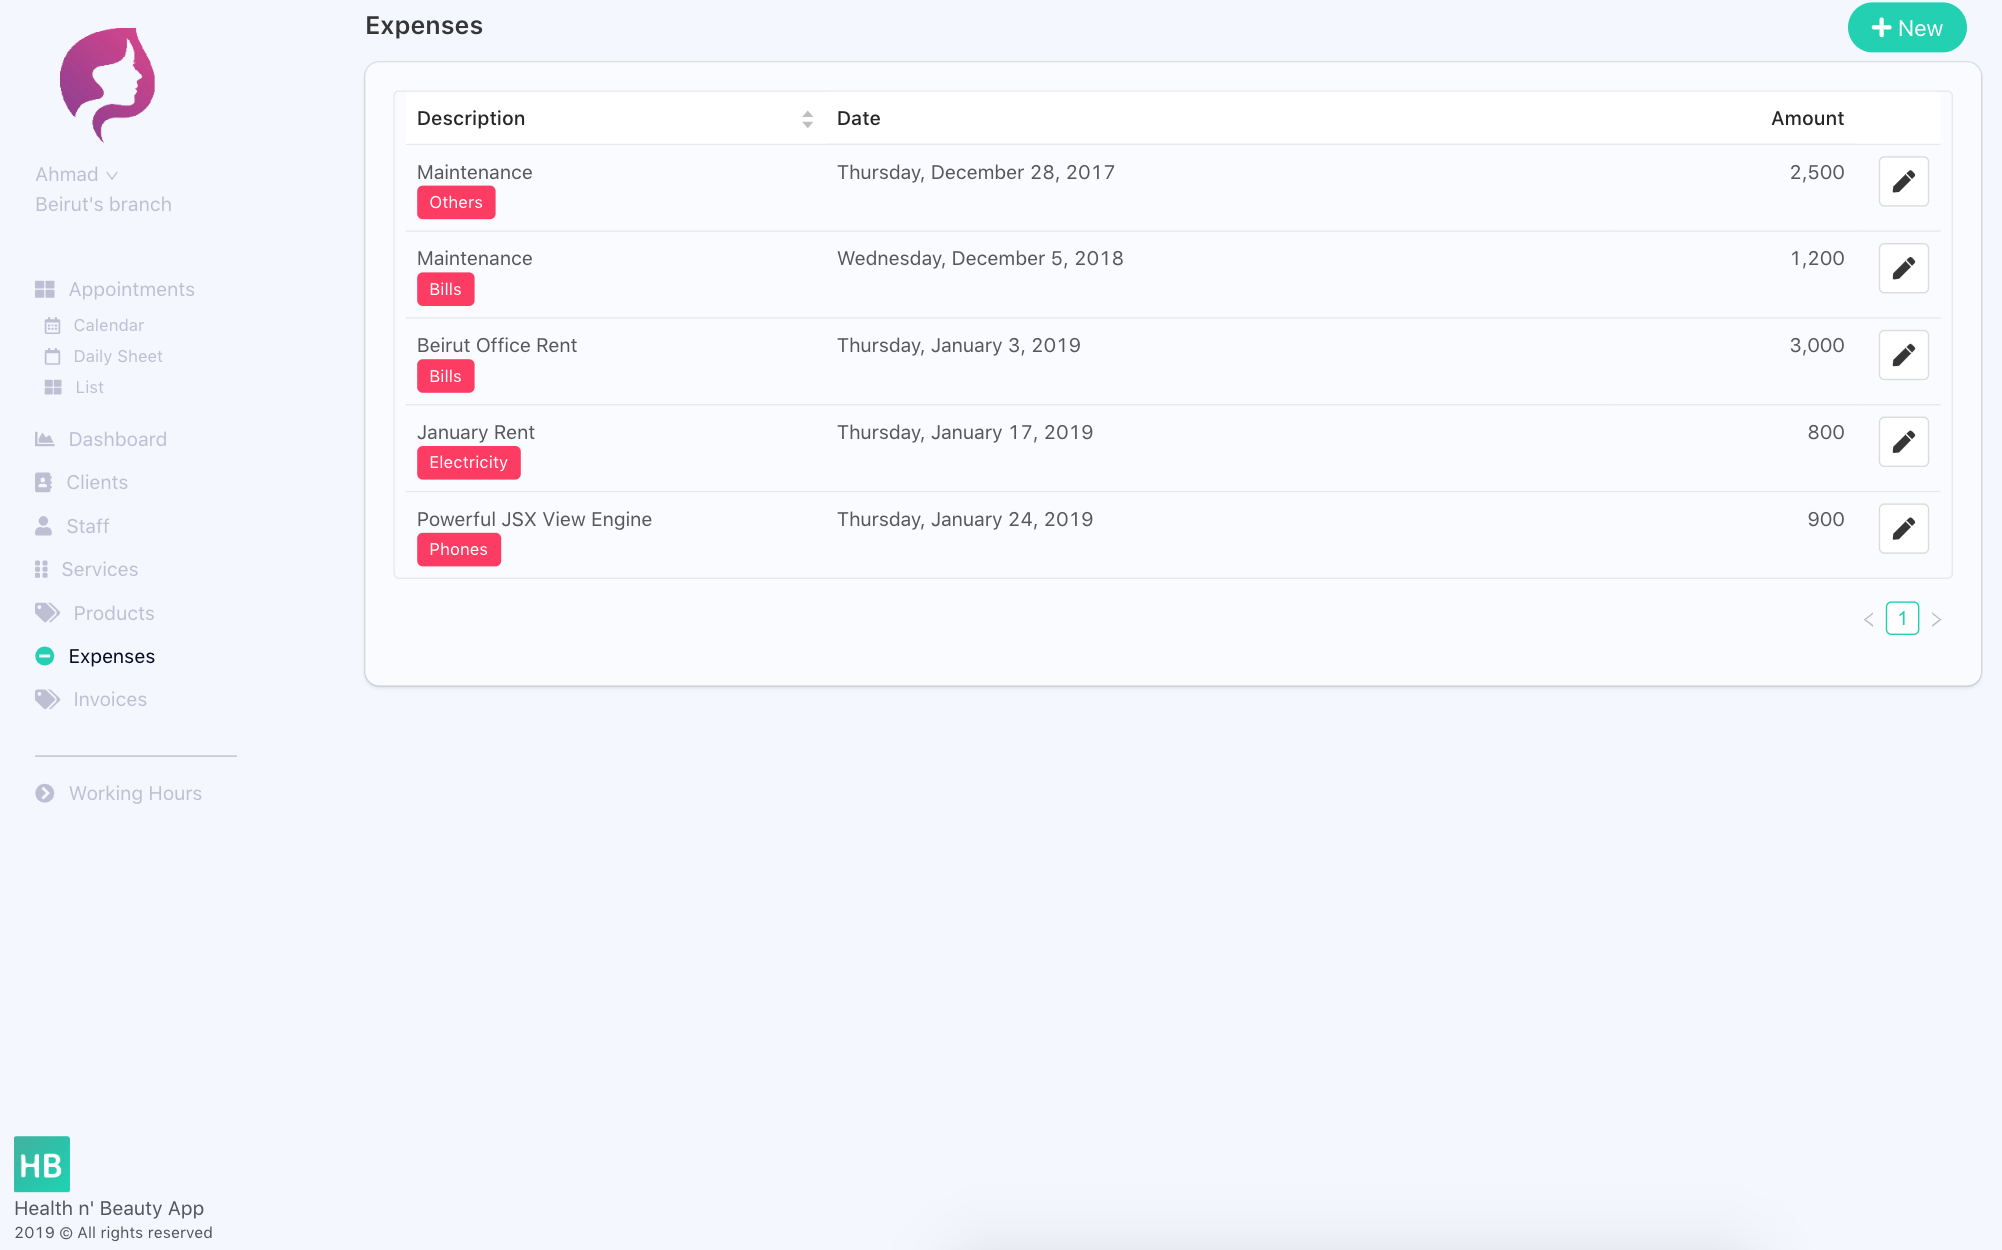
You can now fill your expenses like Electricity Bills, Property Rent, Wages and Salary and any other expense.
By filling expenses you get a more precise numbers about your center financial performance.
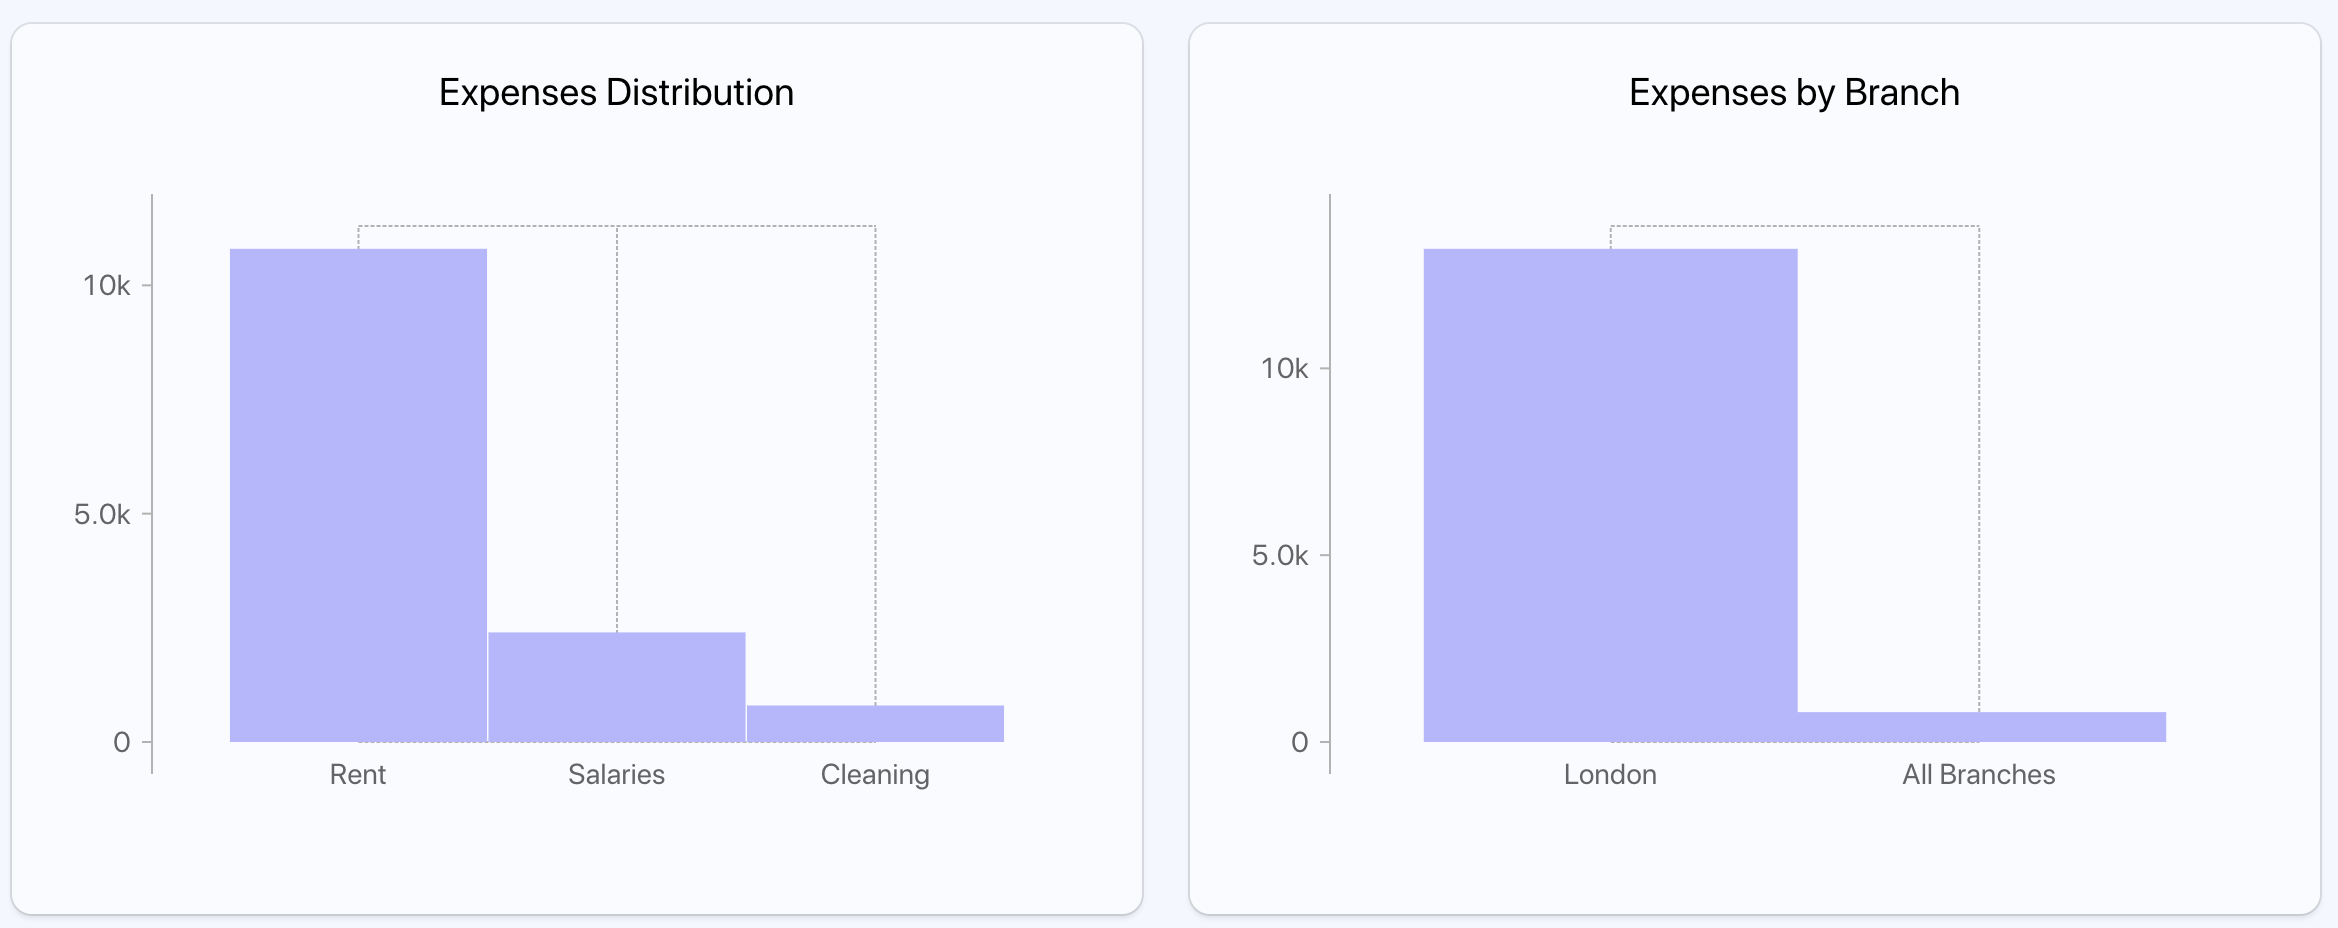
You can see how your expenses are distributed by checking the Expenses section in the Dashboard.
Dashboard Module
We've redesigned the dashboard to help you make your decisions easily. The current dashboard offers the following charts:
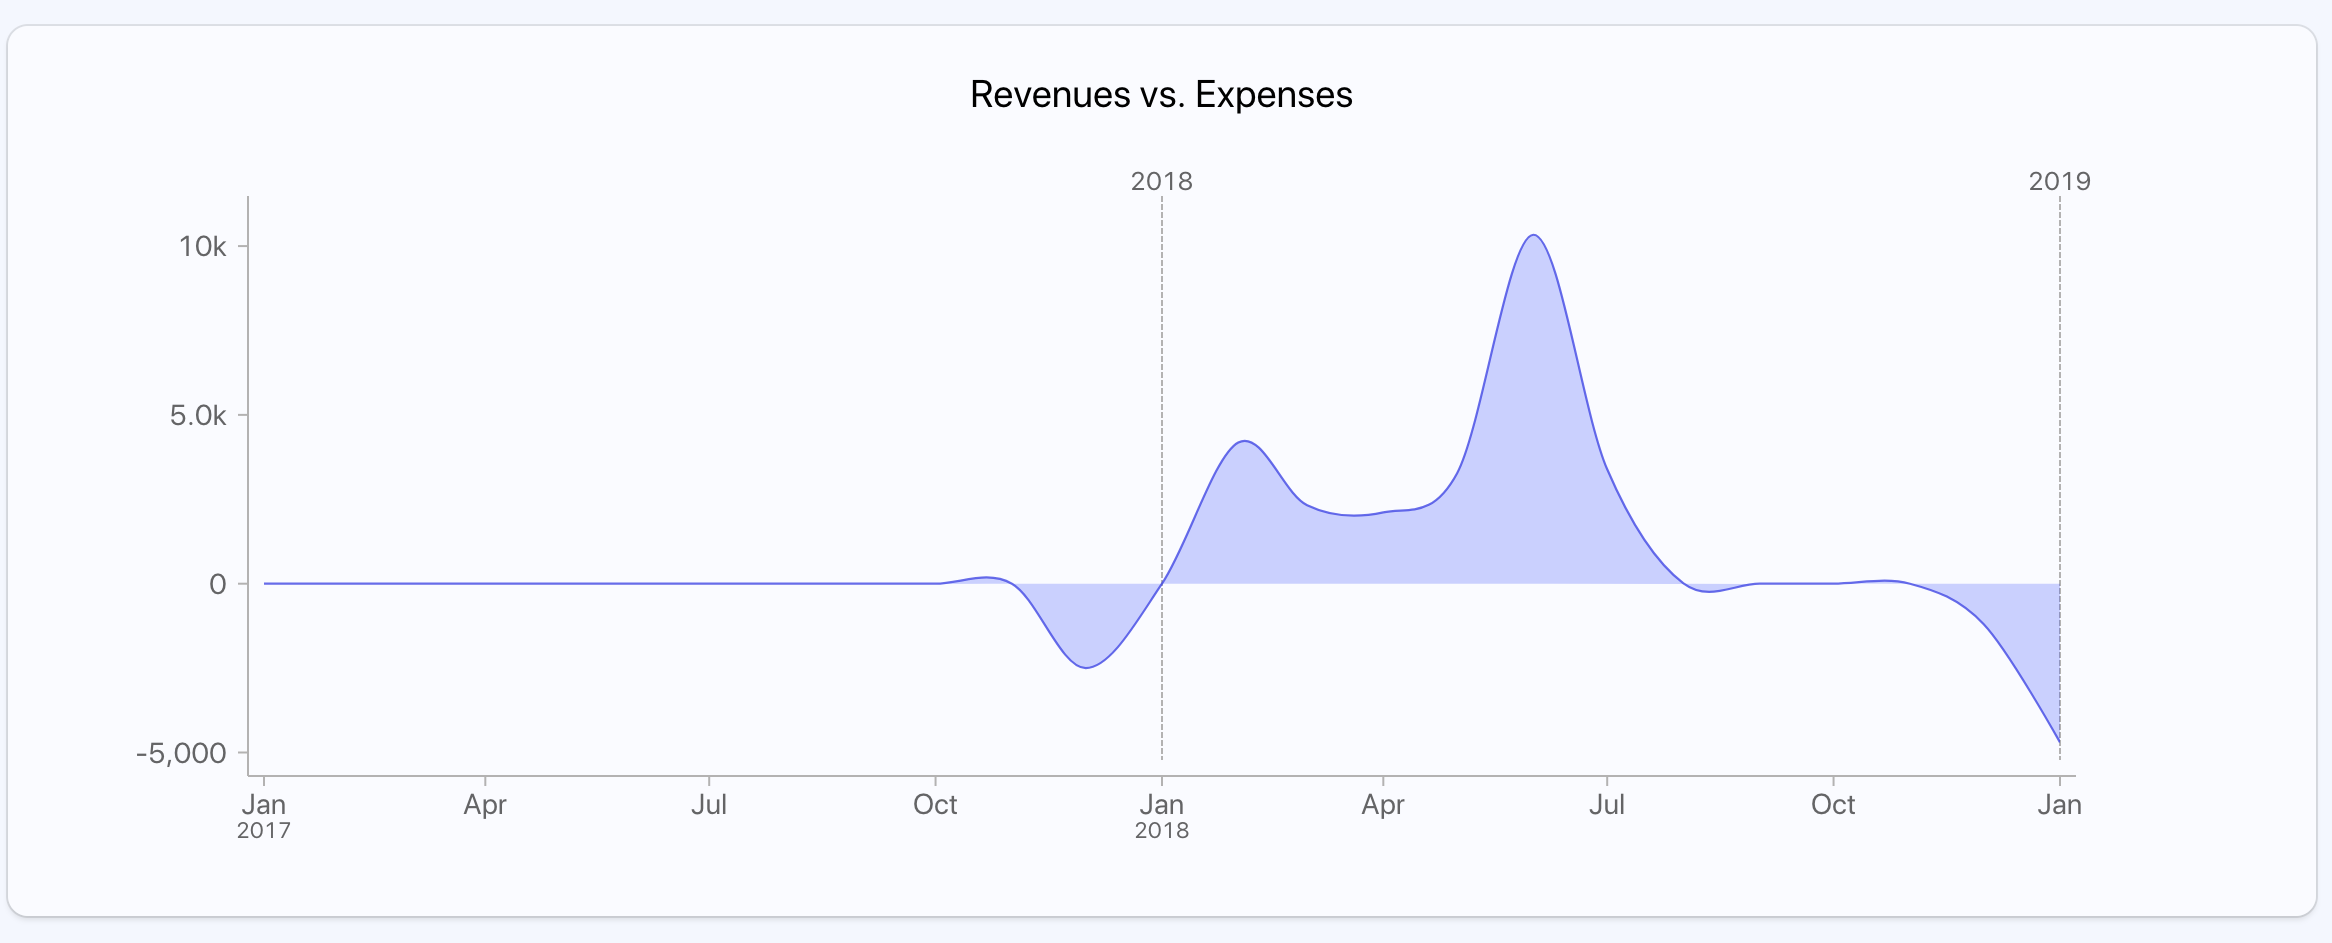
My Cash Balance
The cash balance graph illustrates the Revenues vs Expenses on a monthly basis.
The revenues are calculated from the appointments + the sum of products sold* (not available for all clients)
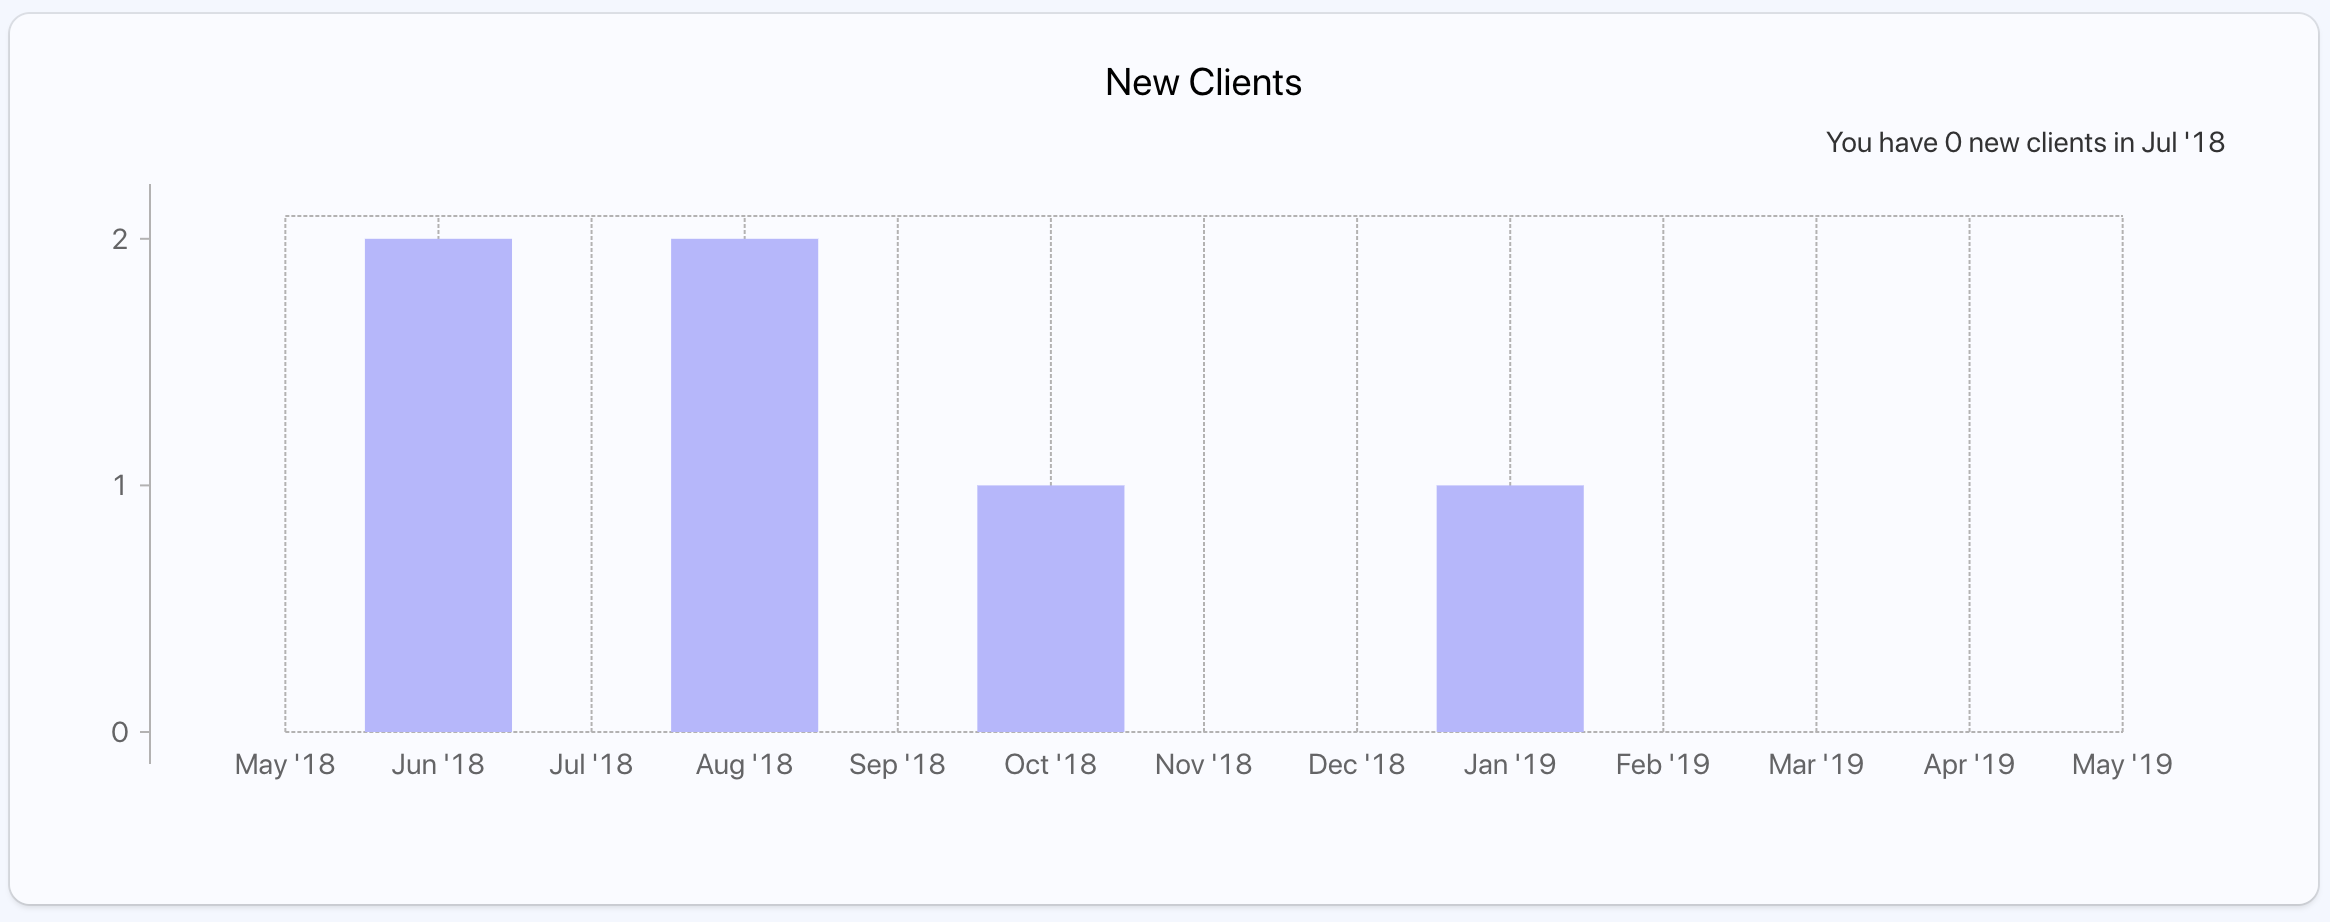
New Clients
The new clients chart illustrates how much new clients you have during the last 12 months.
Most Active Client
This chart shows the most active clients and the number of their visits.
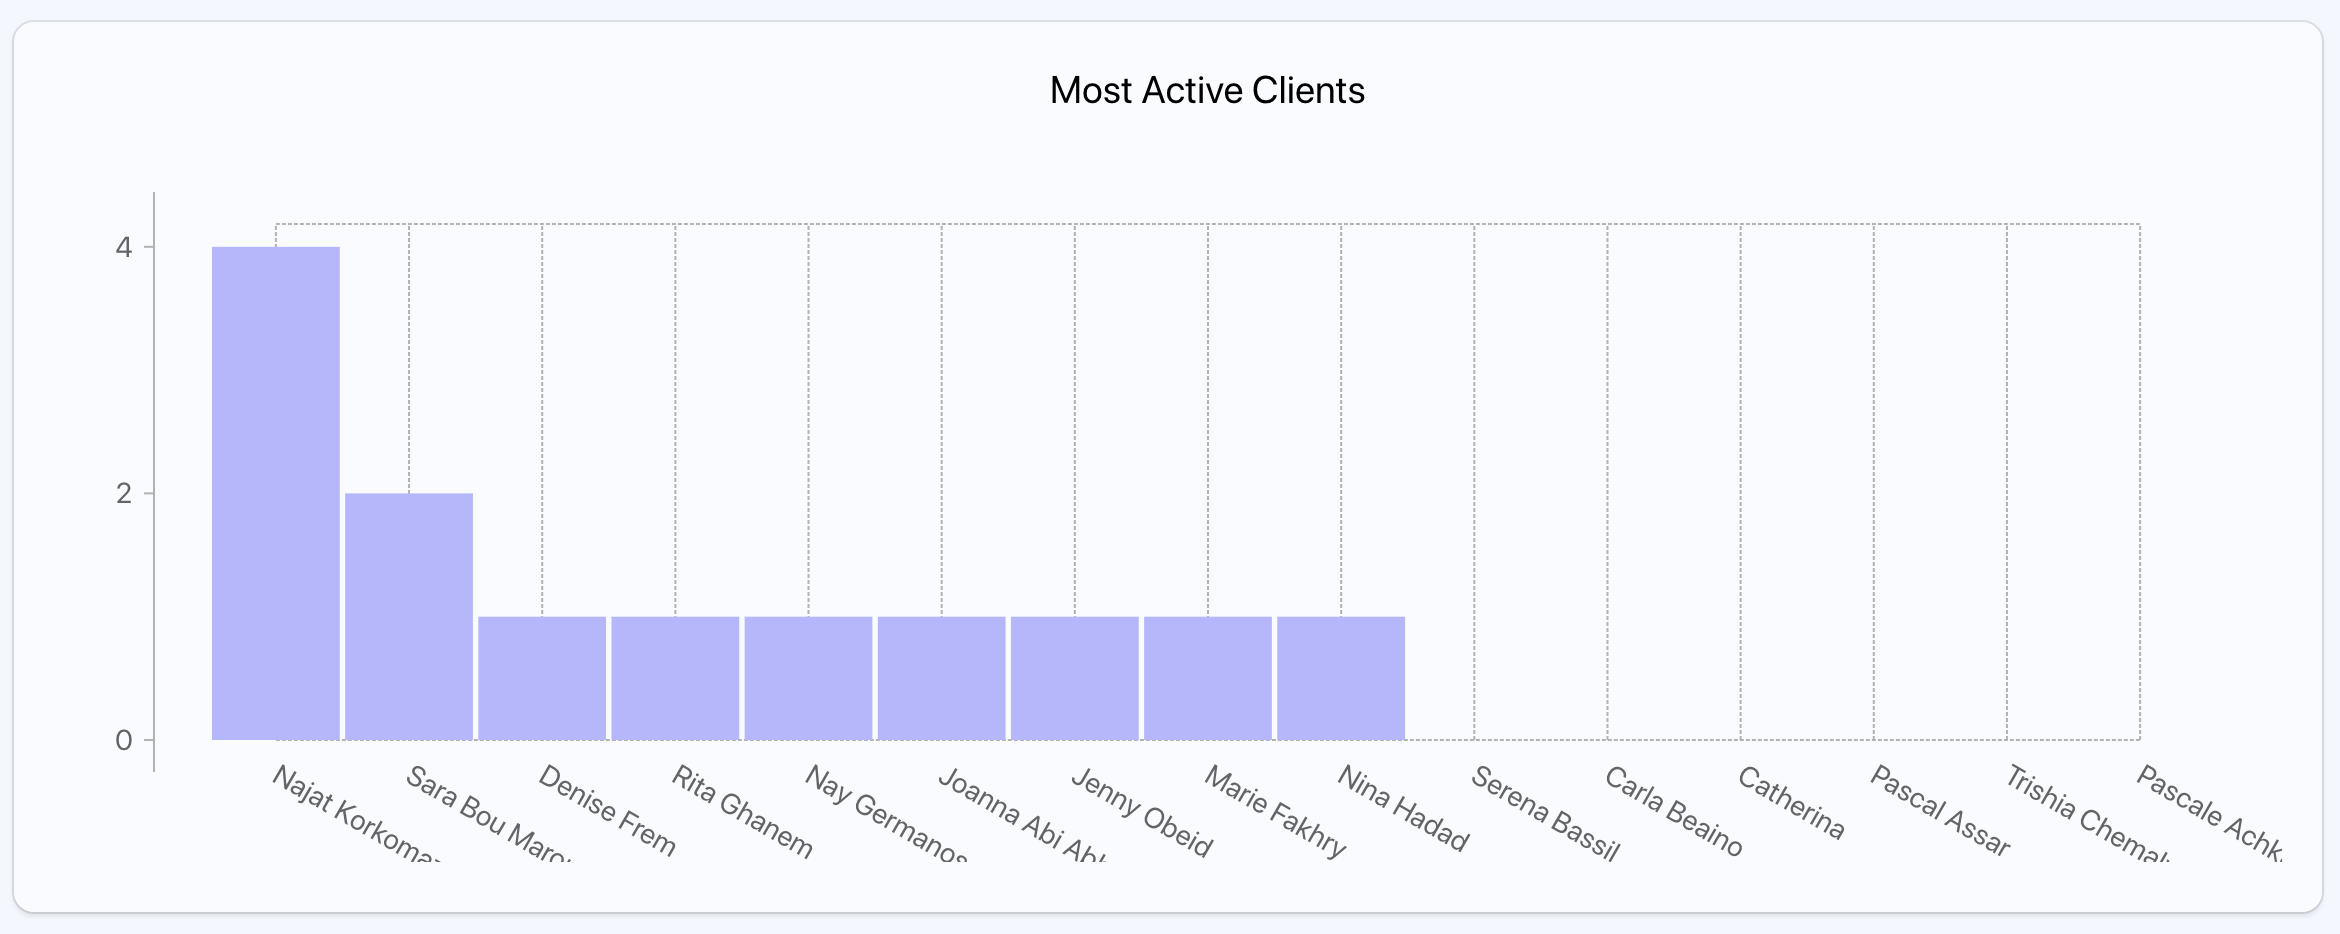
Note: In newer versions you can send promotions and offer discounts for your favorites clients.
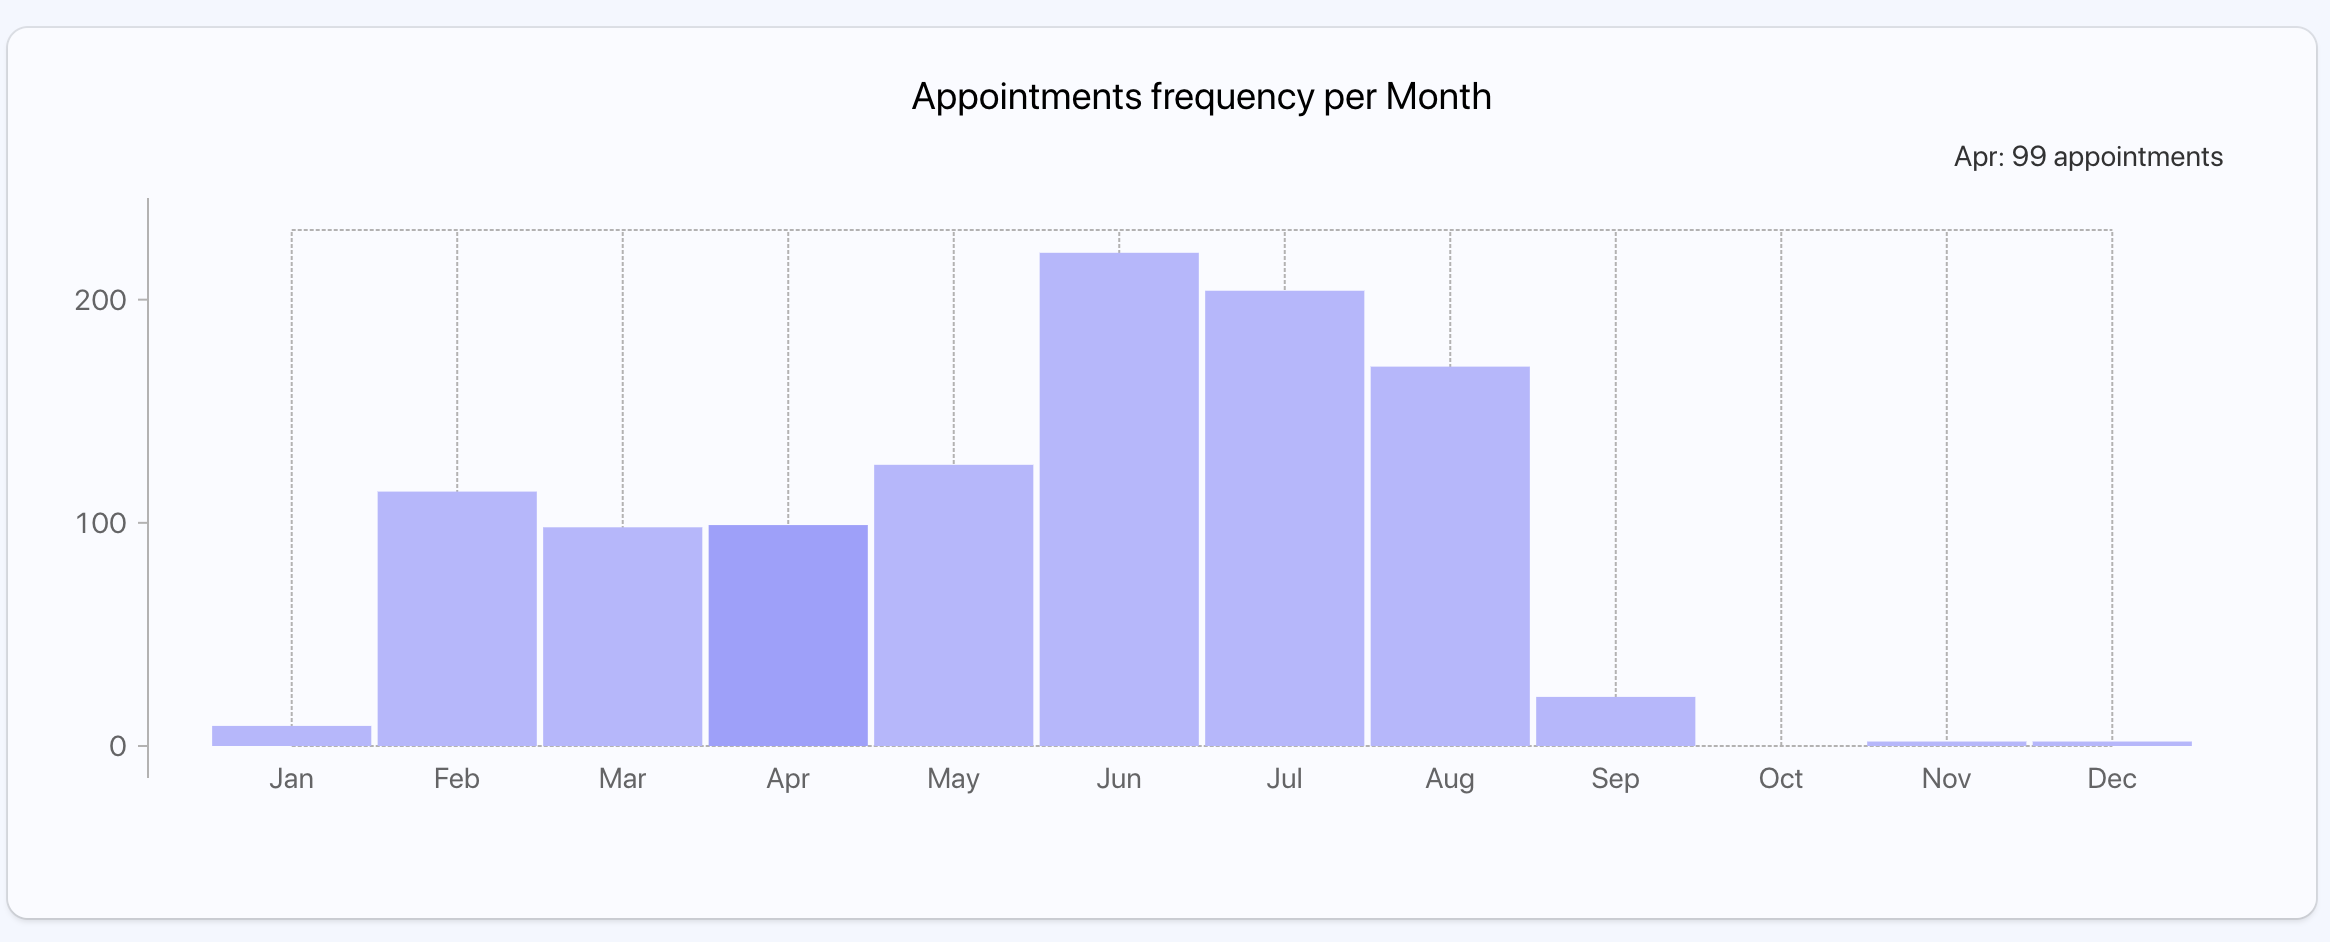
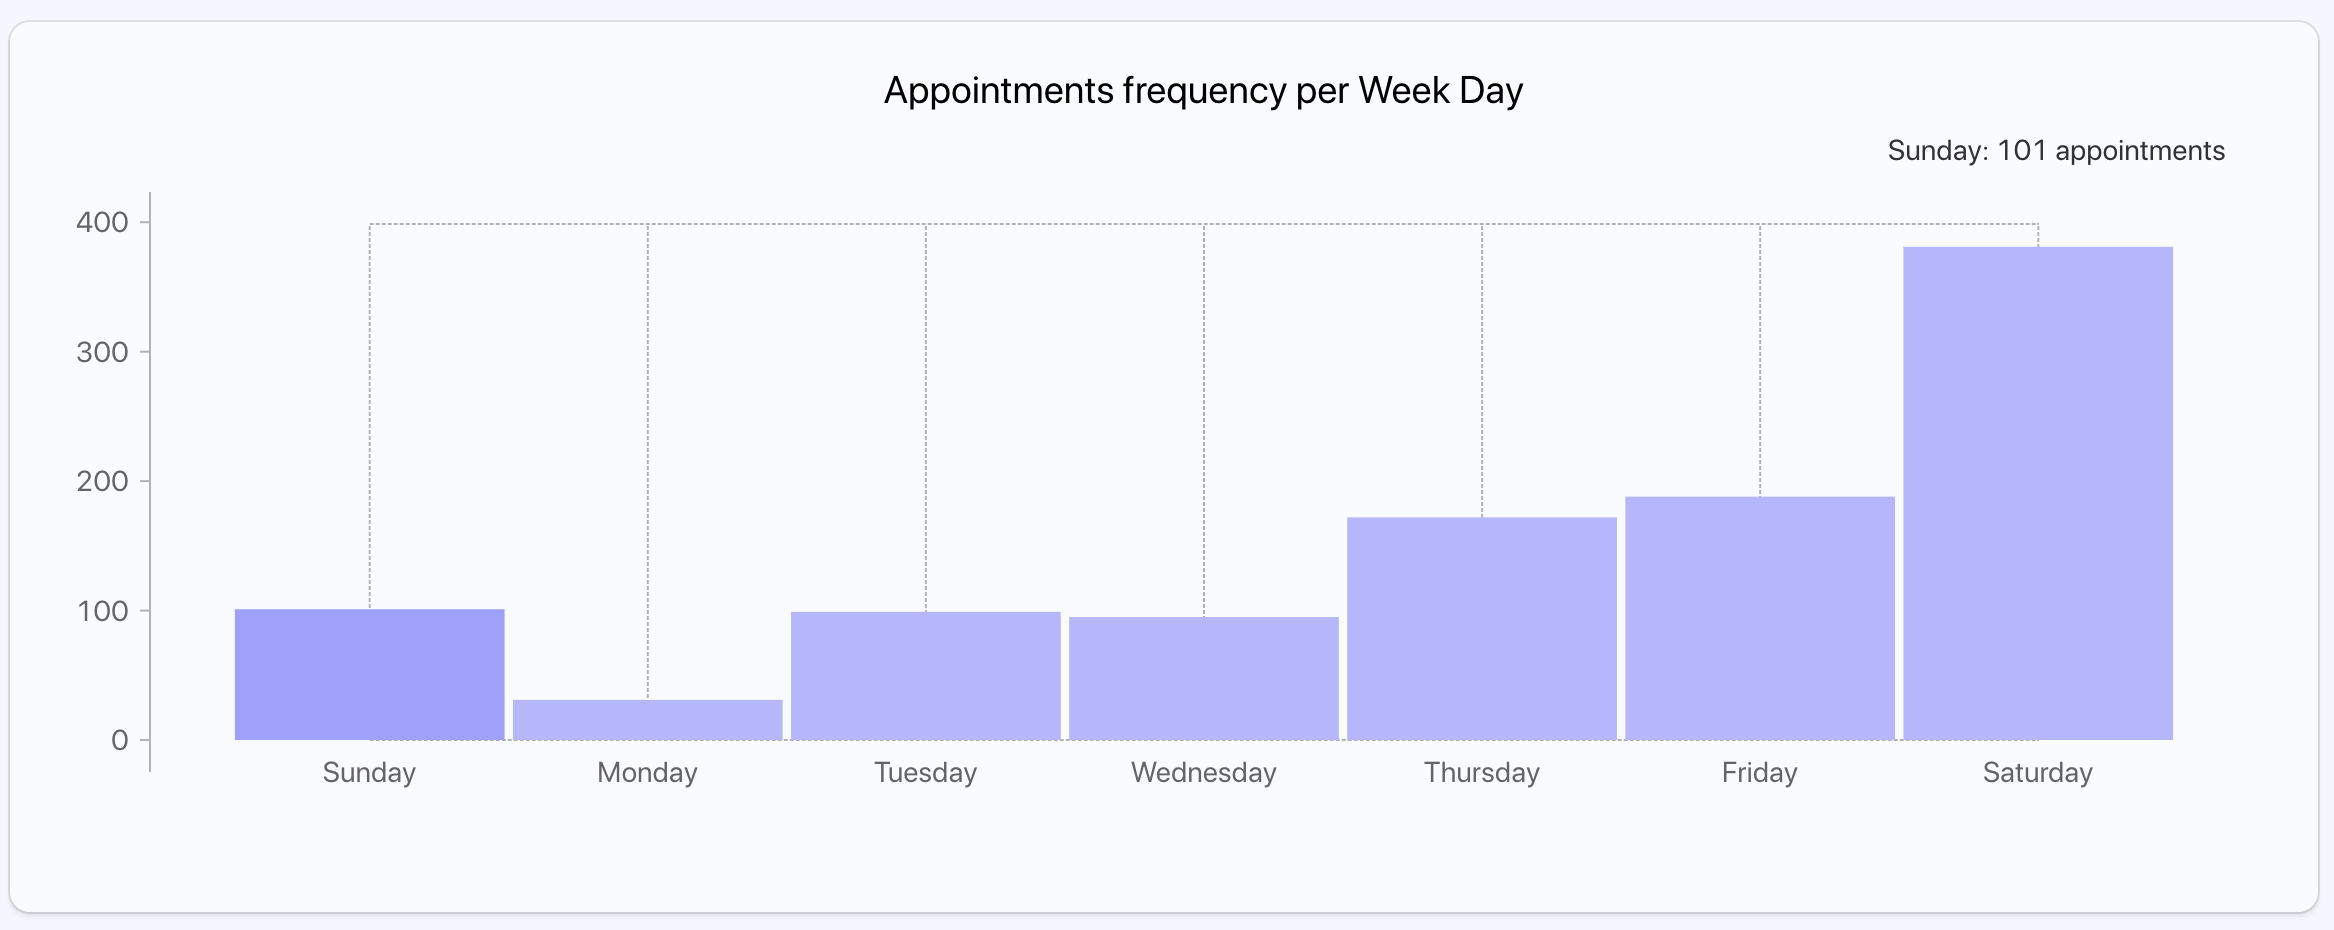
Appointments Frequency
The appointments frequency shows how many appointments are booked each month or each weekday. This will help you analyse your peek periods and plan ahead of time. For example increasing your staff or extending the working hours.
Expense Analysis
As shown above this graph illustrates where your money is spent.

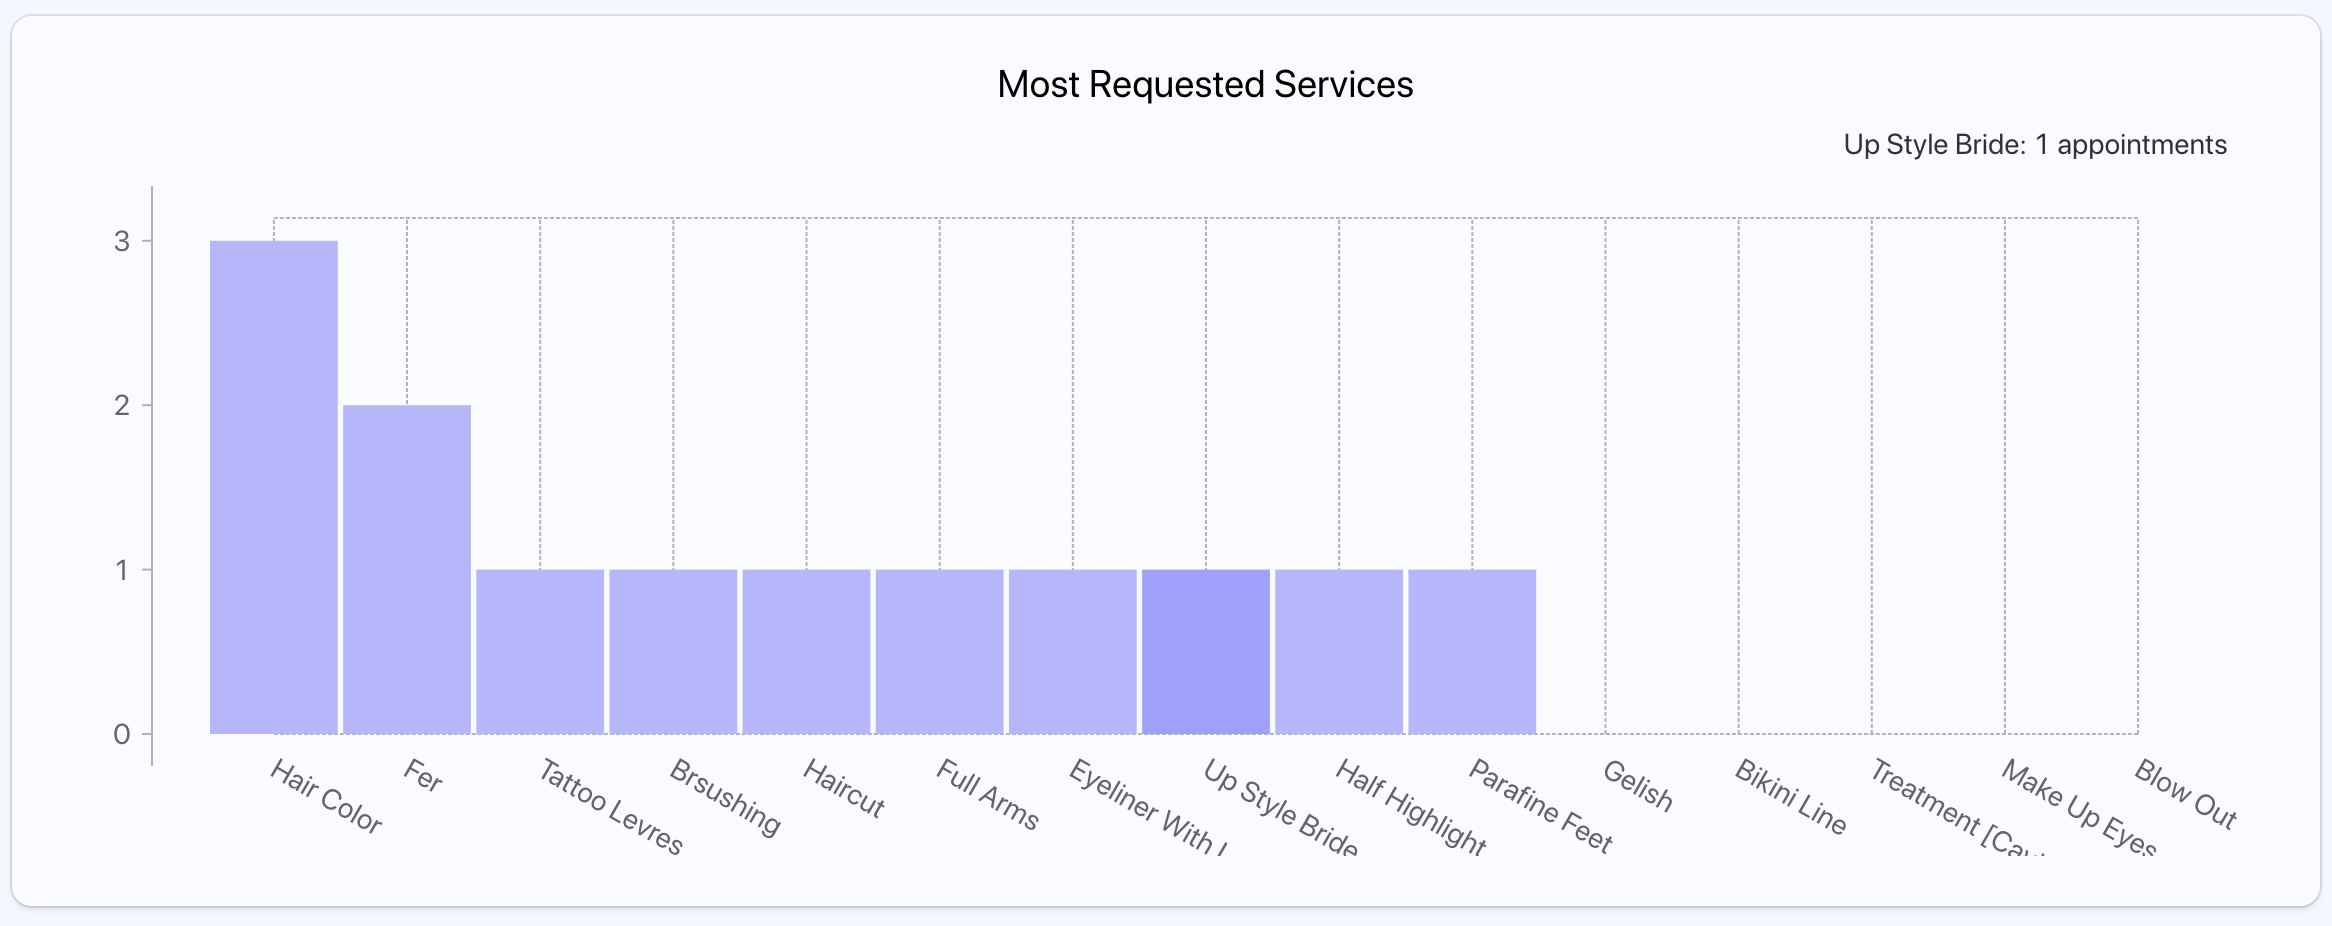
Top Services
This chart shows the most requested services.
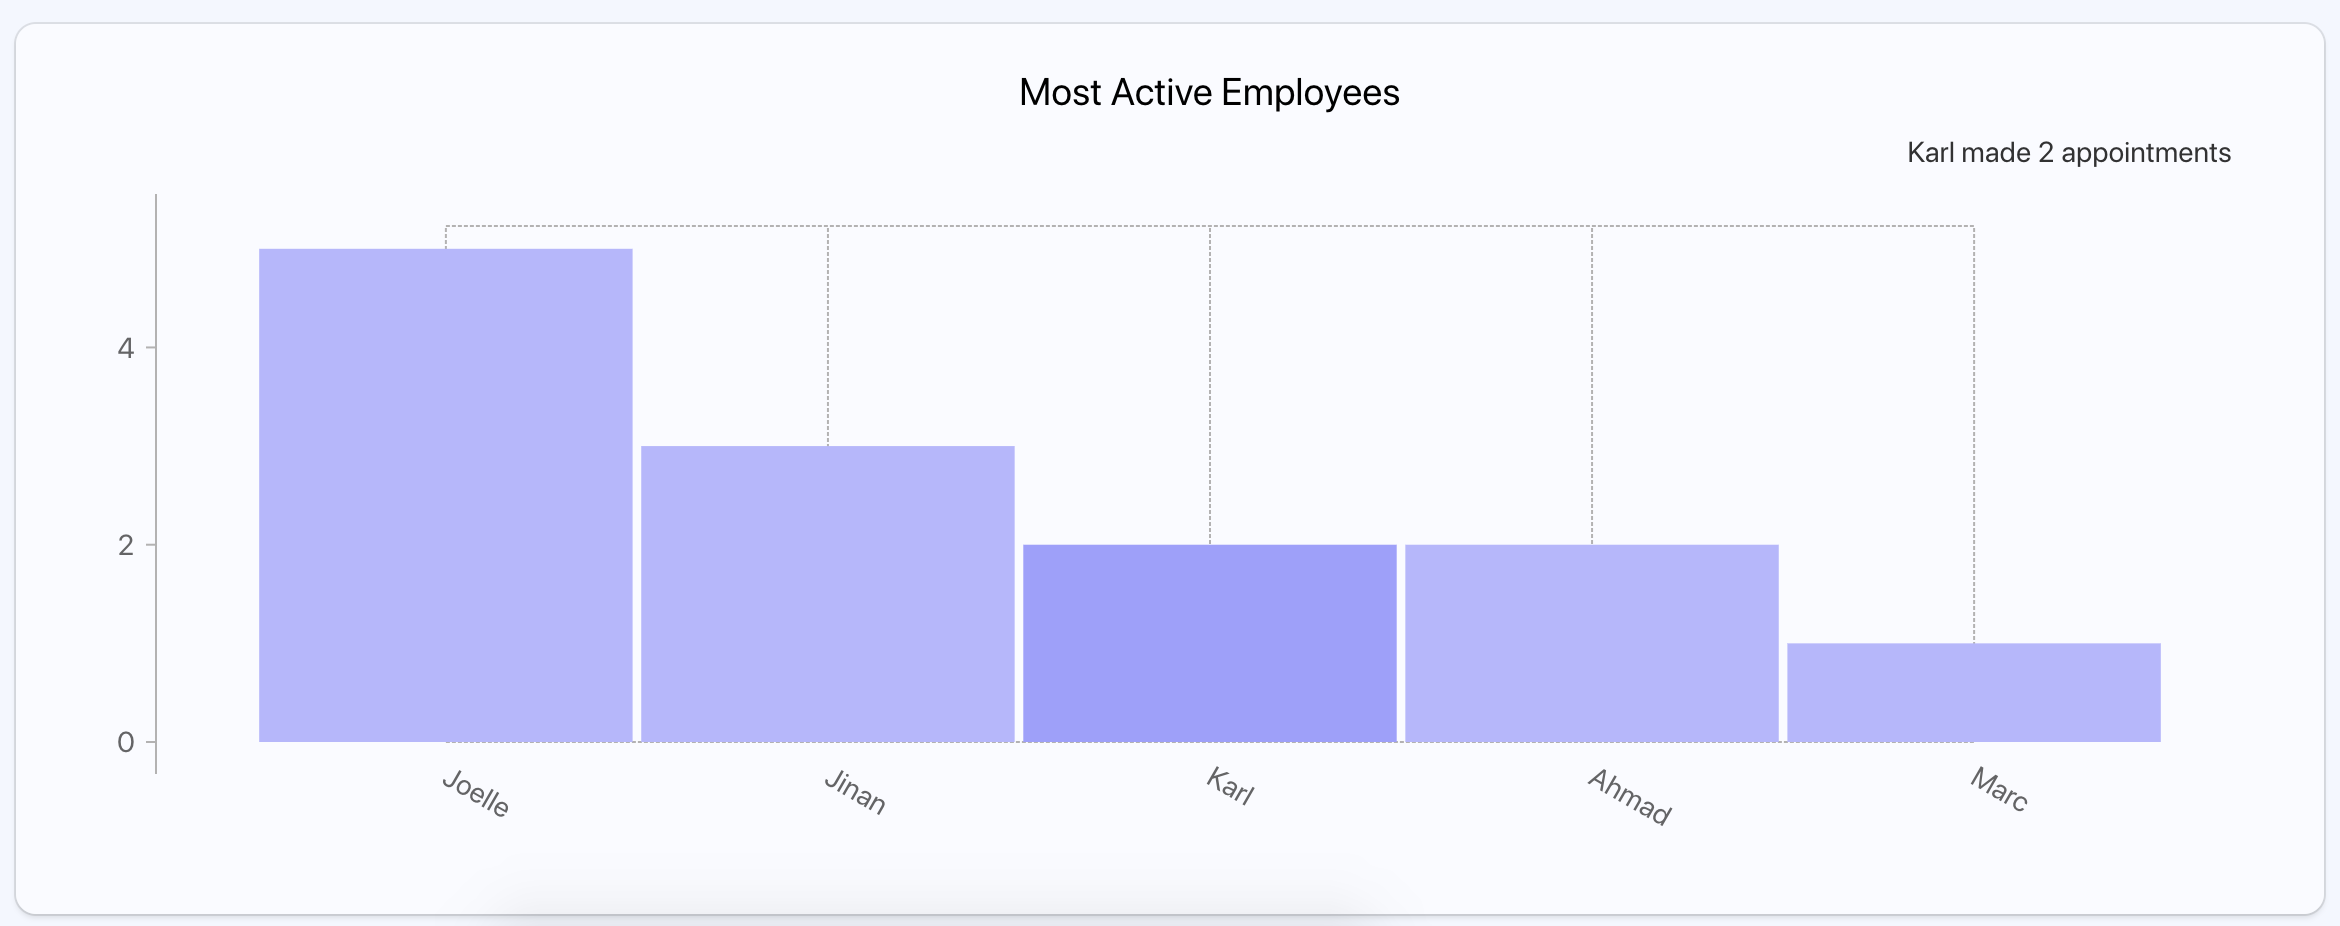
Top Employees
Empowering employees is one of the keys for a successful business. This chart shows the most active staff.
Thank you for reading, if you have any question please send it to lina@helesapp.com.